Colors
Selecting, applying and changing colors used on a chart, or graph is under the users control methods.
Chart area of display colors of indicators, bars, trade details can be customized to meet changes to color backgrounds and grids. All plotted items can be colored by the user, and some chart display items can change for each bar on the chart. Multiple colors can be assigned to a single indicator based upon the script logic created to control color assigned.
Plotting Instrument Permanent Variables (IPV) Series on Charts:
Instrument Permanent Variables designated as an IPV Series-Type, have the option of being plotted on a chart.
Plotting Block Permanent Variables (BPV) Series Custom Graphs:
Block Permanent Variables that use the selection of System, Test, or Simulation Scope feature can be plotted on a Summary Custom Graph that appears in the Trading Blox Summary Test Results report.
Changing Colors:
Colors can be assigned and changed using the variable declaration and editing dialogs, or they can be changed by using the ColorRGB and SetSeriesColorStyle functions.
Control of the plot color of both series is the same. To color a plot series, use the Color option in the Plot section of the series creation dialog, or assign the color using the above function.
When using the Plot section in the series creation dialog, the Colored-button is clicked. A matrix table of common colors will display. Select a color displayed and click OK. If the color you want, click the "More Colors..." button to display additional color option methods.
When the "Custom Color Selection Dialog" any color can be selected or created. New colors can be assigned to the white colored areas so they are made available later. Summary Custom Charts require the reporting option is used.
Colors assigned using the series dialog options typically use the same color across the entire plotted area. When the need to vary the color of plotting item in an IPV series, the SetSeriesColorStyle function can be applied anytime using scripting references during testing.
Selecting Trade Chart Preference Colors:
These preset Preferences can be used in scripting, and they can also be adjusted by users.
Trade chart Preference Default Colors:
Color Property Name: |
Default Color Number: |
|---|---|
ColorBackground |
14745599 |
ColorUpBar |
37632 |
ColorDownBar |
213 |
ColorUpCandle |
37632 |
ColorDownCandle |
213 |
ColorCrossHair |
12632256 |
ColorGrid |
16443110 |
ColorLongTrade |
37632 |
ColorShortTrade |
213 |
ColorTradeEntry |
16764057 |
ColorTradeExit |
16751001 |
ColorTradeStop |
14527197 |
ColorCustom1 |
0 |
ColorCustom2 |
139 |
ColorCustom3 |
16711680 |
ColorCustom4 |
16777215 |
User Series Array Color Control:
BEFORE TEST Script
' ~~~~~~~~~~~~~~~~~~~~~~~~~~~~~~~~~~~~~~~~~~~~~~~~~~~~~~~~~~~~~~
' R , G , B
ColorItem[ 1] = ColorRGB( 0, 0,255 ) ' Blue
ColorItem[ 2] = ColorRGB( 255, 0, 0 ) ' Red
ColorItem[ 3] = ColorRGB( 0,255, 0 ) ' Green
ColorItem[ 4] = ColorRGB( 0, 0, 0 ) ' Black
ColorItem[ 5] = ColorRGB( 49,133,155 ) ' Aqua
ColorItem[ 6] = ColorRGB( 0, 0,192 ) ' Dark Blue
ColorItem[ 7] = ColorRGB( 84,141,212 ) ' Light Blue
ColorItem[ 8] = ColorRGB( 227,108, 9 ) ' Orange
ColorItem[ 9] = ColorRGB( 235,117,123 ) ' Coral
ColorItem[10] = ColorRGB( 94,162, 38 ) ' Dark Green
ColorItem[11] = ColorRGB( 95, 73,122 ) ' Purple
ColorItem[12] = ColorRGB( 160,106, 88 ) ' Brown
ColorItem[13] = ColorRGB( 255,255, 0 ) ' Yellow
' ~~~~~~~~~~~~~~~~~~~~~~~~~~~~~~~~~~~~~~~~~~~~~~~~~~~~~~~~~~~~~~
To use above series, consider this approach shown in AddLineSeries example:
Multi-Line Chart Example:
' Assign each system net rate change to a specific color
plotColor = ColorItem[ systemIndex ]
' Place this system's test-date total equity percentage net change
' value in the chart space using the new color
chart.AddLineSeries( AsSeries(systemEquity), elementCount, _
alternateSystem.name, plotColor )
Trading Blox Color Selection Dialog:
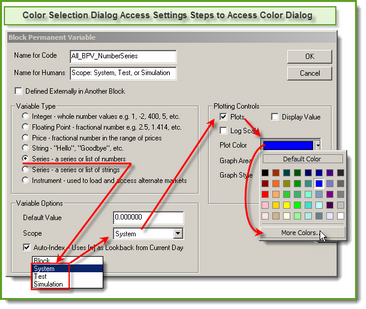
All BPV Series will provide access to the Trading Blox Color Selection Dialog when the BPV series uses a System, Test or Simulation Scope setting with a BPV numeric series.
To display the color selection dialog, follow the click steps in this next image:
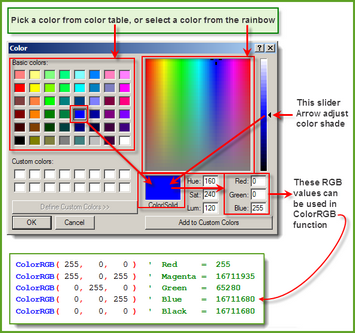
When the "More Colors..." button is clicked the dialog in this next image will appear:
Just about any color's RGB value can be discovered using this dialog. However, if the chart image where this color is to be used will appear in a report generated with a HTML Browser process that is used to create Trading Blox reports, picking a color from the Basic Color Matrix Table will keep the colors used within the Safe-Color range that are easily reproduced using a HTML process.
Applying the RGB, (Red, Green, Blue) values to the Trading Blox ColorRGB function requires, place the color numbers using Blue, Green and Red as the first, second and third parameter locations
Script Color Assignment Examples:
' Red Green Blue
PlotColor1 = ColorRGB( 255, 0, 0 ) ' Plot Red Color
PlotColor2 = ColorRGB( 0, 255, 0 ) ' Plot Green Color
PlotColor3 = ColorRGB( 0, 0, 255 ) ' Plot Blue Color
' Trade Color Preference Settings Color Numbers values
PlotColor1 = ColorCustom1 ' Use Preference ColorCustom1 Value
PlotColor2 = ColorCustom2 ' Use Preference ColorCustom2 Value
PlotColor3 = ColorCustom3 ' Use Preference ColorCustom3 Value
Free Color RGB Identification Software:
ColorPic - Free Download (External Web Site Link)
Link will open the default browser to the web page where this free program ColorPic software will provide the color number of any pixel displayed on computer screen.
Links: |
|---|
AddLineSeries, ColorRGB, SetSeriesColorStyle, Preference Items |
Edit Time: 9/12/2020 10:28:44 AM |
Topic ID#: 203 |


