Monte Carlo Reporting

Contents
Trading Blox Monte Carlo Simulation Results create a large group population samples on which to estimate the probability of the simulation test results. Output results are controlled by the enabling or disabling of the options available in each of the simulation reporting methods, and by the Monte Carlo Options in the Preference Editor.
These can be activated for Single Run and Small Tests, but are not available for Large Simulation Reports.
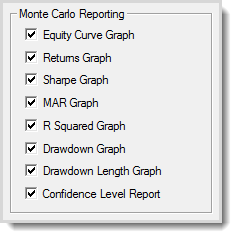
There are seven Monte Carlo Simulations that influence how the Monte Carlo simulation results create:
Monte Carlo Reporting: ^Top |
Description: |
|---|---|
|
|
A log-scale of the different equity graphs overlaid on the test equity curve. |
|
A curve of the distribution frequency and accumulated percentiles of the various returns. This graph won't be useful unless you check Sample with Replacement as the returns will be the same without that checked |
|
Sharpe Graph |
Same as above but with CAGR% for each alternate equity curve. |
MAR Graph |
Same as above but with MAR for each alternate equity curve. |
Same as above but with R-Squared for each alternate equity curve. |
|
Drawdown Graph |
Same as above but with the maximum drawdown, second largest, and third largest for each alternate equity curve. |
Drawdown Length Graph |
Same as above but with the longest drawdown, second longest, and third longest drawdown for each alternate equity curve. |
Confidence Level Report |
A text-based percentile report which will be run as part of the normal performance settings. It shows the values of the performance statistics at the percentiles specified by the confidence level above. NOTE: You must also have Trading Performance and Statistics checked for this report to work. |
List of All Graphic Images: ( Fix-It )
MonteCarloDrawdownGraph_P1.png
MonteCarloDrawdownLengthGraph_P1.png
MonteCarloEquityGraph_P1.png
MonteCarloMARGraph_P1.png
MonteCarloReturnGraph_P1.png
MonteCarloRSquaredGraph_P1.png
MonteCarloSharpeGraph_P1.png
MonthlyDistributionGraph_P1.png
MonthlyReturnsGraph_P1.png
RMultipleContributionGraph_S2_P1.png
RMultipleDistributionGraph_S2_P1.png
Edit Time: 9/12/2020 9:50:00 AM |
Topic ID#: 173 |