<< Click here to display Table of Contents >> Navigation: Monte Carlo Simulations:
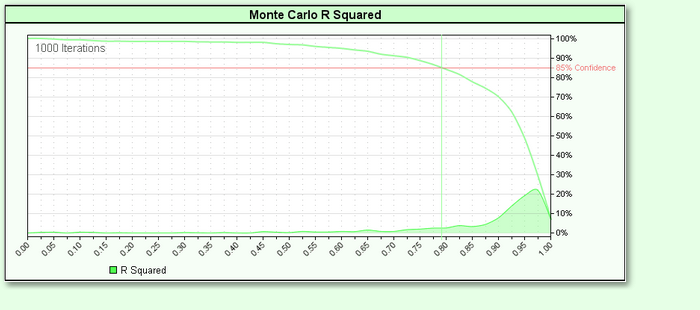
The Monte Carlo R Squared Graph shows a histogram of the distribution and cumulative distribution for the R Squared values for the simulated equity curves.
Edit Time: 2/18/2022 3:35:42 PM
Topic ID#: 198