Monte Carlo

Contents
Trading Blox Monte Carlo Simulation Results create a large group population samples on which to estimate the probability of the simulation test results.
The settings in this Monte Carlo preferences section determine how Trading Blox the Monte Carlo data randomizing loops generate statistical probabilities from the original population of suite simulation results. The primary test results are randomly re-sampled the number of times listed in the Monte Carlo's Iteration setting field. An optional Sample and Replacement option allows for additional variation results. Maximum Equity Curves to Graph provides the backdrop upon which the primary test result are overlaid to provide a visual reference of how the original results are positioned relative to the large Monte Carlo group of results.
There are seven Monte Carlo Simulation controls that influence Monte Carlo simulation results:
Preference Setting: |
Description: |
|---|---|
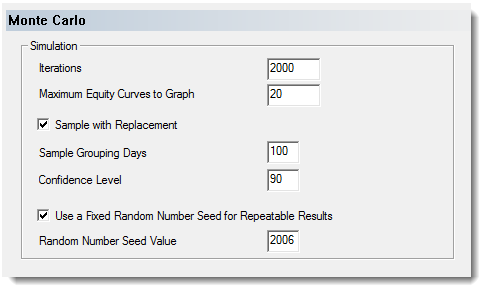
Iterations: ^Top |
This controls the total number of separate alternate equity curves which are used to generate the reports. Bigger is better but bigger takes longer. We recommend leaving these set to 2000 for a 10 year test. |
Maximum Equity Curves to Graph: ^Top |
This controls how many equity curves out of the total number of iterations will be graphed on the Monte Carlo Equity Curve Graph. You can set this to the same as iterations but this might result in it being impossible to see any distinct equity curves since they will all write over each other. |
Sample with Replacement: ^Top |
This controls how the alternate equity curves are generated. If you check this it means that we will randomly select a portion of the equity curve and the same portion might be selected more than once. This setting will result in differing end points for the equity curve.
If this setting is not checked it will result in a simple reordering of the equity curve since each section of the initial equity curve will only be selected once and only once. |
Sample Grouping Days: ^Top |
This controls how many consecutive days at a time are selected from the initial equity curve. A setting greater than one will preserve some of the serial correlation in the initial equity curve. |
Confidence Level: ^Top |
This setting controls where the confidence lines are placed the graphs. It is a percentage which can range from 1 to 100. It also controls the value for the Confidence Level report. For example, if you set this to 85, we will report the MAR, CAGR%, Sharpe Ratio, R-Squared value, maximum drawdowns and length at the 85th percentile. In other words that value where 85% of the simulations had worse performance. This is fairly obvious from the graphs and is easier to understand when you look at it than by reading this. |
Use a Fixed Random Number Seed for Repeatable Results: ^Top |
When this is checked, then the seed value of the next field will be used to seed the random number generator. Effectively, this means that the sequence will repeat each time. When left unchecked a new random seed will start the random number sequence which means that each sequence will be different.
Use this field setting to determine if the number of iterations is sufficient. For smaller numbers of iterations, less than a few thousand, you will get different graphs and confidence level values when there is a different set of random numbers. If this happens, it is a sign the number of iterations is not sufficient. |
Random Number Seed Value: ^Top |
The value to use to start the random number sequence. This setting is ignored if the above is not checked. |
Links: |
|---|
|
See Also: |
|
Edit Time: 9/12/2020 9:50:00 AM |
Topic ID#: 5013 |