Graphical Reporting

Contents
All reporting items on the left side of this image are options in all three of the test type reports. Control of which type of report is selected by Trading Blox is determined by the settings in the Reporting General section :

Options on the right side of the image are only available when a simulation test enables parameter stepping in the testing suite. Top two items are available in the Small and Large Simulation Reporting setting sections, but Results Filtering is only available when a Large Simulation Report is executing.
Graphical Reporting: ^Top |
Description: |
|---|---|
Graph of Total Equity and Closed Equity on a logarithmic scale. |
|
Graph of Total Equity and Closed Equity on a linear scale with drawdowns. |
|
Custom Graphs |
This option enables the display the Custom graphs that are created in block scripts to appear at the end of a test in the Custom Graph section of the Summary Test Results report .
Graphs displayed are created in a user blox script location. These scripts collect test information in a BPV-variable during a test so it can be displayed in the Custom Graph. For example, Margin Equity as a percentage of Total Equity can be added as one of the graphs displayed to reveal the level of margin that was used during the test. |
Graph of the Monthly Returns. |
|
Graph showing the distribution of the Monthly Returns. |
|
Graph of the total risk to Total Equity and Closed Equity. |
|
Graph showing the distribution of trades by R-Multiple™. |
|
Graph showing the profit contribution of trades by R-Multiple™. |
|
Parameter Step Graph |
|
Muti-Parameter Graph |
|
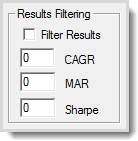
Large Simulation Reporting will allow a user to enter the minimum value for any or all of the statistical calculation options shown in this section. Entering information in any of the three data fields will be the basis for which reports are saved for reviewing at the end of a test. Once the values to filter are entered, the Filter Result option must be enabled. When left disabled, the end of test filtering of the test step performance will be ignored.
Large Simulation Filters: ^Top |
Filter Settings: |
Description: |
|---|---|---|
|
Filter Results |
Enable or Disable Option - Controls the simulation's ability to reject test step results that are below any of the three values set in each of the statistical fields. |
[CAGR-value] |
CAGR Enter minimum value to accept reporting CAGR value. |
|
[MAR-value] |
MAR Enter minimum value to accept reporting MAR value. |
|
[Sharpe-value] |
Sharpe Enter minimum value to accept reporting Sharpe value. |
List of All Graphic Images: ( Fix-It )
LinearEquityDrawdownGraph_P1.png
LogarithmicEquityGraph_P1.png
MonthlyReturnsGraph_P1.png
MonthlyDistributionGraph_P1.png
RiskGraph_P1.png
<User Custom Graphs>
Edit Time: 2/18/2022 3:35:42 PM |
Topic ID#: 152 |