Equity Curve Graph

Contents
The Monte Carlo Equity Graph plots a number of the Monte Carlo simulation alternate equity curves on the same graph with the tests actual equity plotted in blue.
This is a Monte Carlo Equity Graph:
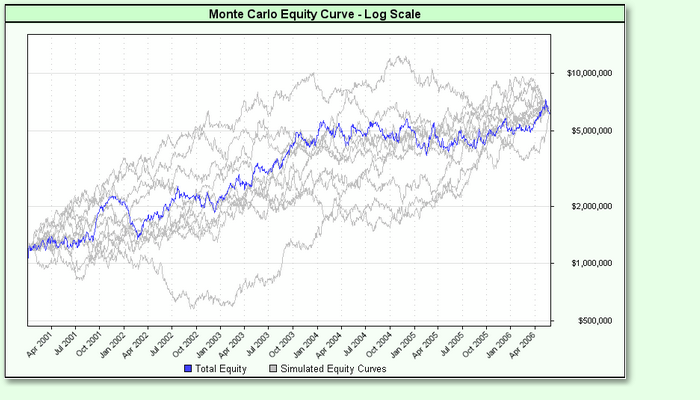
The number of equity curves to plot can be set with the "Maximum Equity Curves to Graph" preference found here: Monte Carlo. The above graph shows a value of 10 for "Maximum Equity Curves to Graph".
Edit Time: 9/12/2020 9:50:00 AM |
Topic ID#: 172 |