Block Permanent Variables
Block Permanent Variables (BPV) have the same value regardless of instrument.
At the start of a test, all BPV variables are initialized to a user specified value. The default value is zero. This initialization value is retained until the value changed by scripts when a test performed.
All BPV variables are accessible to all the block script sections in a block. That access can be increased to other blocks when the scope setting for a BPV variable selects a scope value that is not Block. BPV variables work faster than script-section created Local Variables. BPV variables initialize to the established default value that was entered when the BPV variable was created. BPV Initialization happens in the Before Test script section at the beginning of a test.
The initialization value, or the latest assigned value in a BPV variable is the same regardless of which instrument is the focus of a test. For example, the scripting assigns a day value to a BPV value early in the test process, that value will be the same for all the instruments being tested and will stay the same until scripting is used again to change the value.
Creating & Editing BPV Variables:
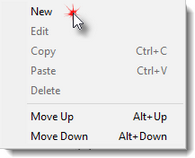
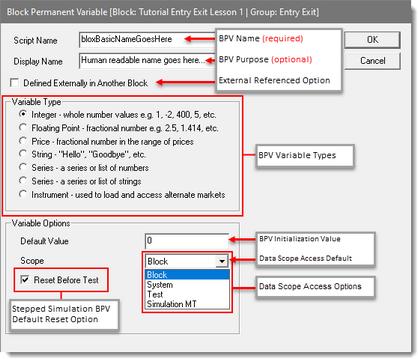
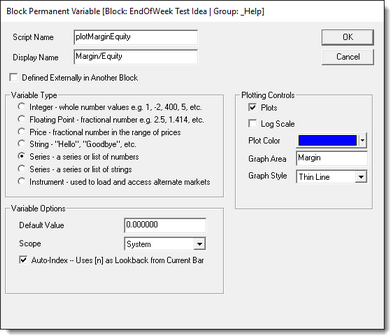
Double-Clicking on the Block Permanent Variables menu option above, or by Right-Clicking the Block Permanent Variables will display BPV Variable Editor Dialog shown next.
Variable Script Name & Display Name: |
Descriptions: |
|---|---|
This is the name seen in the BPV Variable List section and in the scripted statements where it is used.
Variable names cannot have a space or any of the special characters in the name. However, an underscore character "_" are allowed.
Use variables names that make sense to you when you create them or change them. When a variable name is changed, it will need to be change every place where it is used in script sections where it is used. Variable names that are descriptive will improve the understanding of why they are created and applied. Descriptive names also help to reduce the mystery of a statement's purpose. For example, if you want the variable to hold the current day-of-month value (dayInMonth), that name reflects the variables purpose. Better understanding of a variable's purpose is a key factor in preventing and reduce mistakes.
Trading Blox Builder Common naming convention: •Use a Lower-Case letter as the first character in a name for Object Property variables. •Uses an Upper-Case first letter for functions. |
|
This field is optional, but when it is used, consider using text that provides a description of the BPV variable's purpose.
This field is displayed in the variable declaration section of the block, when it is Previewed or Printed using the option in the Editor's File menu. |
|
Defined Externally in Another Block
|
This information explains the: Defined Elsewhere option. |
Descriptions: |
|
|---|---|
Any Integer numeric value (e.g. 1, -2,400, 5, etc.) |
|
Any Decimal/Fractional numeric value (e.g. 2.5, 1.414, etc.) |
|
Any instrument fractional number in the symbol's range of price values |
|
Any keyboard character. Value passed as letters must be bounded by quote marks (e.g. "Hello", "Goodbye", etc.) two dimensional bpv string arrays, works the same way as two dimensional number arrays |
|
All data elements in a Numeric series are a Floating Point variables. A series, also know as an array, are an indexed list of numeric value locations that can hold the same value, or a different a value in each of the series elements. Auto-Index Series match the instrument's date information and use the same index offset that the instrument's data use. i.e., an instrument.close[0], represents the current close price. An instrument.close[1] represents the previous date's close price. That same offset number process is how the information can be accessed in an Auto-Index numeric series.
A numeric series can be Manually-Index. Manually-Indexed series require the user to determine the size of the series, this means how many variable places will be needed, and how to access the series requires the user to create the indexing and searching scripts to access information.
Numeric Series/Arrays, can only contain a list of numbers. These can be tied to the test day using the "Auto-Index" feature described below. They can also be a fixed manually sized series that can be expanded or reduce using scripting. Fixed series are access by an index that is managed by scripted statements. |
|
All data elements in a String series are a text character containers. A String Series, also know as an array, are a list of String locations that can hold the same, or a different Strings in each of the element locations. Numeric Series/Arrays, can only contain a list of numbers. These can be tied to the test day using the "Auto-Index" feature described below. They can also be a fixed manually sized series that can be expanded or reduce using scripting. - a series or list of strings A Series of Strings can be used for many purposes, but also as the x axis label of custom charts. |
|
A BPV Instrument type variable is a series variable that emulates the properties and methods associated with all the Instrument Permanent variables (IPV). In simple terms, they become containers for an instrument's data, properties and functions so the instrument can be accessed in a script section that does not automatically provide instrument access.
A BPV Instrument type variable provides a container that allows the LoadSymbol function to get an instrument so the instrument's data, properties and functions can be accessed and used.
To create a BPV Instrument, the user selects Variable Type Instrument and gives it a name. Fpr tjos example, I'll use the name Mkt. I could have any other name like Corn, Bonds, or inst. The only limitation in naming is to not use a Trading Blox Builder Keyword. The name selected will act like an Object reference that enables access to the instrument contents.
A BPV Instrument can be used in a For-Next loop to add information to all or many of the instrument's in the portfolio. More than one BPV Instrument can be used to calculate differences, or change some property values.
Click on this link to learn how to use the LoadSymbol function.
The Trading Blox Builder Roundtable Blox Market Place has more examples that show different purposes for loading IPV instrument information into a BPV instrument. |
|
Note: Variable Names and Types cannot be changed using scripts. To make a change to either, that change must be done using the BPV Variable Editor. There is more information In the About Data Variables topic and some variable use examples. |
|
Variable Options: |
Descriptions: |
|---|---|
The value entered into this field will be the initialized value this variable will have at the beginning of a test. Initialized values and be changed by script statements or functions. |
|
The selected Data Scope determines where this variable can be accessed and changed.
BPV variables are allowed to use the following scope settings: •Block -- This scope allows the variable to accessible only within the blox where it is declared. •System -- Allows this variable to accessible from within any of the blocks in the System where this block is listed. •Test -- Allows this variable to be accessible in any of the block in any of the systems within the testing Suite. This scope is the same as Test scope, except the value will not be reset when the Suite is performing a multi-step parameter test. This means the last value of this variable will be the value that appears at the beginning of the next parameter testing step. |
|
|
A BPV Series with Auto Index checked, will track the test.currentDay index. When Auto-Index is NOT Enabled, the series will be a static series that is managed and a accessed with scripting. |
|
This option will not appear unless the BPV numeric-series type is selected and is using System-Scope setting.
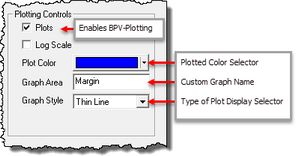
The numeric variable type that has a System scope setting will display this Ploting Control area where the user can create a chart graphic to display the numeric series information:
•The color of a graphed plot is assigned using the Plotted Color Selector. •The graph name where the plotted information is to appear is determined by the name entered into the Graph Area field. •The type of plotted display is based upon the selection appearing in the Graph Style selector. •When more than one series is being plotted in a custom graph, and one of those series has enabled "Log Scale" option, then all series plotting in the same Graph Area will plot as log scale. •When you plot more than one BPV variable in a custom graph, be sure the ranges of the all the series is within a reasonable range for all the series being plotted in that same graph area so the display is readable and consistent. •When a blox is used to create a custom graph, and that blox is inserted in multiple systems, there will be multiple plotted graphs displaying information from each of the systems. This is also true when you use multiple plotting statements in in your test, then multiple Summary Custom Charts will be created for each one. |
|
Plotting BPV Series variables on the Summary Custom Chart
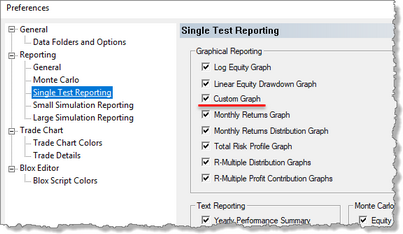
Be sure to enable the Custom Graph check-box in the Preferences' Single Test Reporting section. See the Trading Blox Builder User's Guide manual Reporting Information's Graphical Reporting topic for more information.
Graph Plotting:
To plot a BPV-Series variable, the defined Scope setting must select either the System, or the Test scope option. This setting will enable the BPV-Variable Editor to display the Plotting Control area.
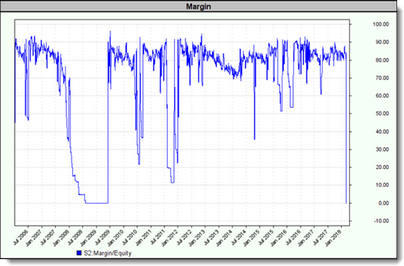
BPV variables defined to create a Custom Graph image at the end of test Will appear something like this next graph image:
The above graph is an example that display the amount of Margin as a percentage of the Test's Total-Equity. This graph is created and displayed in the Custom Graph area of the Performance Summary report.
Graph's created for a Performance Summary Report are saved in the Results section. In the Results section there will be a folder that matches the Performance Summary file date and time information. Contained in that folder are all the graphs displayed in the Performance Summary report.
Custom Graph are static images used for reporting. This needed approach for reported prevents the image from display any of the plot location values that a cursor might select. However, the data used to create a Custom Graph is easily be exported to the Print Output.csv file, or to a custom file that can be used to see the values as a text, or a spreadsheet table or plotted chart.
Script Statement Example:
' To plot the Margin to Equity ratio, create the BPV
' below and put the following in the After Trading Day script:
plotMarginEquity = test.totalMargin / test.totalEquity * 100
Edit Time: 10/29/2020 1:37:28 PM |
Topic ID#: 310 |


