Test Trades Report

Contents
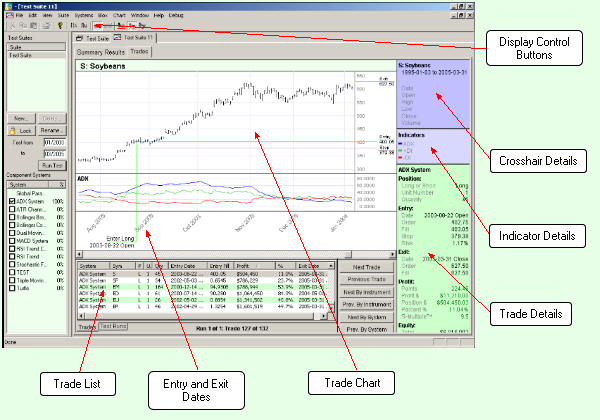
The Test Trades Report shows each of the trades for a given Test, when you have "Log Trades" turned on in Test Reporting preferences. If you have this unchecked, then you will see no "Trades" tab. Each Test Trades Report has the following areas:
Display Control Buttons The tool bar has buttons which allow single-click access to common menu actions for controlling the chart display including: expanding and collapsing the width of a price bar; showing and hiding the trade indicators; and controlling how many trades are displayed at the same time.
Trade Chart The selected trade is plotted on a daily bar chart graph of the prices for the particular market or stock issue. The indicators for the system that generated the trade are also plotted on the graph so you can see how the system indicators control trade entry and exit. The Chart menu and associated buttons on the tool bar control which trades are displayed on the graph.
Entry and Exit Dates The entry and exit dates for the selected trade are shown below the chart date legend. These show the exact date and time of entry (Open, Day, or Close).
Trade List A complete list of each trade for the test is shown below the chart. When you click on a trade in the list, Trading Blox will select that trade and display the appropriate chart. You can sort the list by clicking on any of the column headers. For example, you can easily determine the largest percentage losing trades by clicking on the Profit % column.
An Exit Rule is added to positions that are forced to exit by the application: •Broker Position Exit is caused by a new broker position that must exit the exiting open position, or a broker position of OUT. •End of Data is an exit on the last bar of data when Running a Simulation. These positions are not exited when Generating Orders. •Test End Exit is an exit at the end date of the test (based on the test start and end dates), when the last bar of data is not reached.
Cross-hair Details When you move the mouse over the chart area, Trading Blox draws a cross-hair on the chart and draws the details of the bar under the current mouse position in the Cross-hair Details pane. It also displays the price associated with the current vertical mouse position. These values update immediately as you move the mouse across the chart. You can take manual control of the cross hairs by double clicking on the chart. The arrows will then be enabled for moving the cross hairs. To resume the automatic mouse control of the cross hairs just double click in the chart area again.
Indicator Details The Indicator Details pane shows the values for the system indicators as of the close one day prior to the day associated with the bar under the current mouse position. The indicators let you graphically see the reasons a particular trade was initiated, e.g. a moving average crossover, a breakout, etc.
The trade chart has a pop up menu if you right click on any indicator or plotting series. If the series is 'display' but not 'plotting' (as defined in the Blox Editor) you can Enable Plotting for this chart. Likewise you can Disable Plotting, or Remove the indicator from the list completely. Once removed, you cannot then enable or disable plotting. These actions are for the current chart only, and do not affect other charts, or future charts created by a new simulation.
Entry and Exit Prices The trade Entry, Exit, and initial Stop are plotted so you can visually see the exact trade prices.
Trade Details The bottom right pane shows the details of each trade including: entry and exit dates and prices, profit, profit %, entry risk %, trade duration, etc.
"En Trading" is the Entry Trading Equity (system.tradingEquity) for the day prior to the trade entry date. So this is the equity used for trade size computation if using system.tradingEquity, as the Fixed Fractional Money Manager does.
Pressing Z will zoom the chart and R will reduce the chart, once a trade has been selected. Pressing Shift while scrolling the chart will freeze the scale.
If the screen is too small to display all the information at once, the cross hair and indicator info will be removed when a trade is selected, so that the green trade information section has the full display. When the cross hairs are again engaged, the cross hair and indicator information will again present on top of the trade information.
|