Multi-Parameter Surface Chart
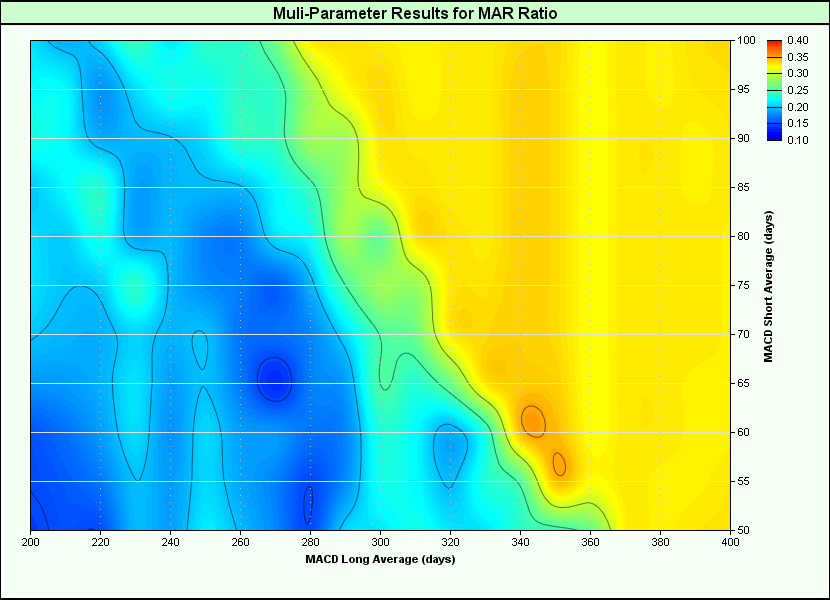
When you run two or more stepped parameters in the same test, the results will be shown in a contoured surface chart. All combinations of the steps will be graphed on the x and y axis. The average selected Goodness Measure Index will be shown as various colors.
You can select which goodness measure to use in Preferences, and you can set the scaling to be automatic or manual.
If you run a stepped test with more than two parameters, the Goodness Measure Index will be averaged for all results at a given x and y axis.
Multiple charts can be produced simultaneously in one simulation by use the test.SetGoodnessToChart() function in Blox Basic.
Each chart can be turned on or off in the TradingBlox.ini file by setting the Multi Parameter 1 and Multi Parameter 2 parameters to true or false. This is useful if you prefer one chart to the other, and want to turn one off.
Multi Parameter Chart 1 = FALSE
Multi Parameter Chart 2 = TRUE

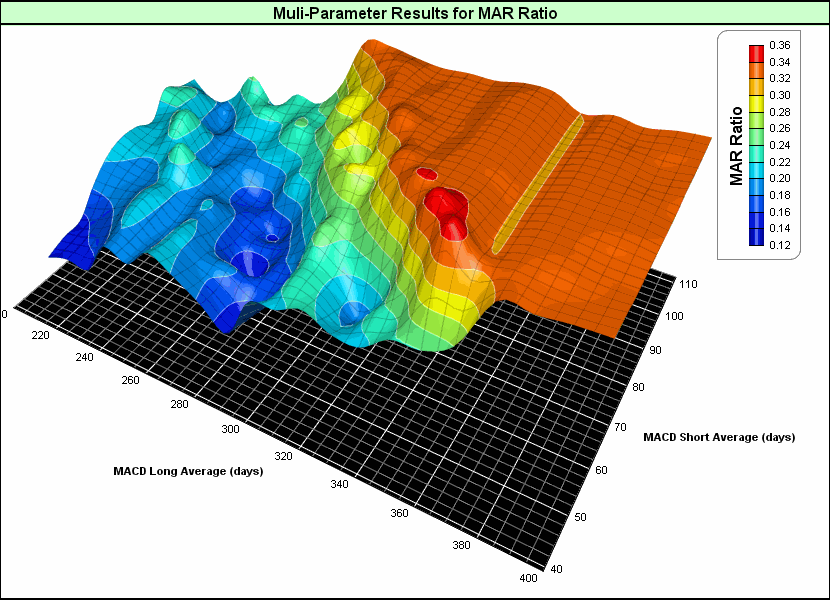
In addition, the Blox Builder Edition provides a 3D look at multi parameter chart:

Edit Time: 9/12/2020 9:50:00 AM |
Topic ID#: 179 |
