Drawdown Length Graph

Contents
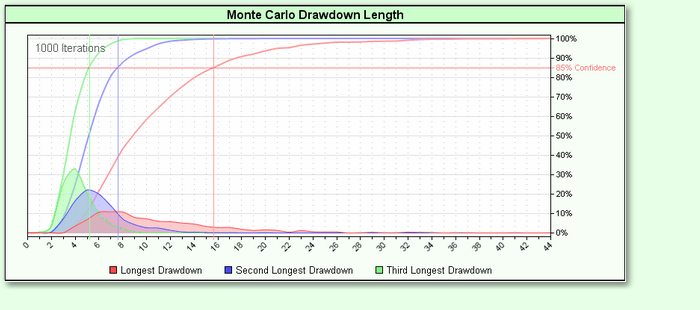
The Monte Carlo Drawdown Length Graph shows a histogram of the distribution and cumulative distribution for the lengths of the drawdowns (in months) for the simulated equity curves.
Edit Time: 9/12/2020 9:50:00 AM |
Topic ID#: 129 |