Sharpe Graph

Contents
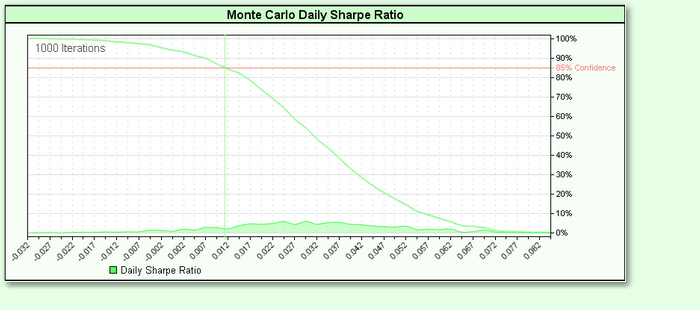
The Monte Carlo Sharpe Graph shows a histogram of the distribution and cumulative distribution for the Daily Geometric Sharpe Ratio of the simulated equity curves.
Edit Time: 9/12/2020 9:50:00 AM |
Topic ID#: 200 |
The Monte Carlo Sharpe Graph shows a histogram of the distribution and cumulative distribution for the Daily Geometric Sharpe Ratio of the simulated equity curves.
Edit Time: 9/12/2020 9:50:00 AM |
Topic ID#: 200 |