Returns Graph

Contents
The Monte Carlo Returns Graph shows a histogram of the distribution and cumulative distribution for the returns expressed as CAGR%.
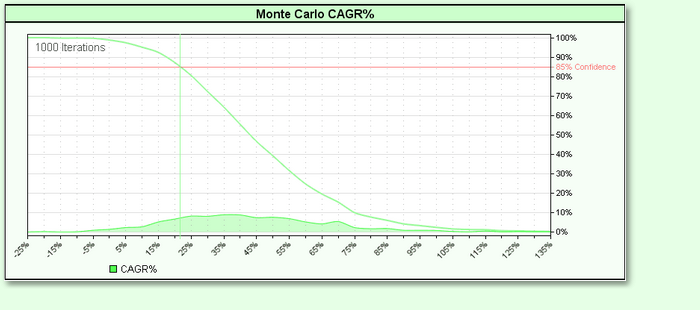
In the above example, the 90% confidence level corresponds to about 22% CAGR, meaning that 85% of the simulated equity curves showed a return of 22% or better. The distribution is centered around 35% but shows some simulated curves with a CAGR% as low as -25% and as high as 125%.
Edit Time: 9/12/2020 9:50:00 AM |
Topic ID#: 174 |