True Strength Indicator
True Strength as a chart Indicator is available in the Variables section of the Blox Editor.

Bill Blau published this indicator in Stocks & Commodities November of 1991 issue. A PDF of the indicator's description was found here: https://tinyurl.com/h8d7krf
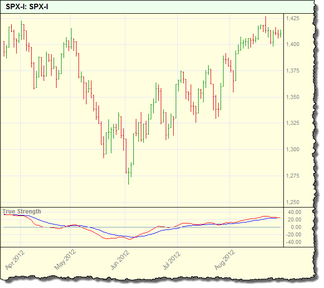
This indicator is shown in the article as a two line crossover oscillator:
Indicator's process applies an exponential average (EMA) to two different approaches of momentum series. For example, a first calculation method uses the raw momentum value of x-period EMA that is then smoothed again by a y-period EMA.
The second momentum method uses the ABS of the raw momentum calculation the x-period EMA that is also smoothed by an EMA over a y-period. Each line's oscillator display is created by dividing the raw smoothed result of the first method by the ABS smoothed results of the second method. Division results creates one of the lines of a directional index oscillator that can be smoothed again. A second line display is created using the same division result with a no smoothing or smoothing of a different period.
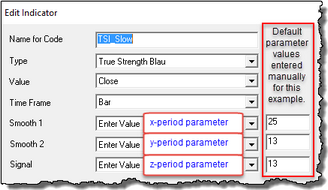
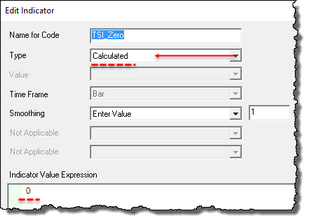
Above image shows the settings for the first line. Settings for the second line are the same except for the Signal parameter value. Second line, colored red shows a Signal value of one. Zero line is created by creating a calculated indicator with the value of zero placed into its script coding section:
Edit Time: 9/12/2020 10:28:46 AM |
Topic ID#: 52 |


