AddScatter

Contents
Scatter charts show unconnected shapes that reflect the two-dimensional values of each data point intersection on supplied data series.
Syntax: |
|---|
chart.AddScatter(AsSeries(xSeries),AsSeries(ySeries),ElementCount,[Symbol],[Size]) |
Parameter: |
Description: |
||||||||||||||||
|---|---|---|---|---|---|---|---|---|---|---|---|---|---|---|---|---|---|
xSeries |
An array of numbers representing the x values of the data points. If no explicit x coordinates are used in the chart (eg. using an enumerated x-axis), an empty array may be used for this argument. |
||||||||||||||||
ySeries |
An array of numbers representing the y values of the data points.
Note: Use with all BPV Numeric or String series that are passed to any Chart parameter.
AsSeries(...) function conditions the series so the chart function will be able to use the information contained within each of the series elements. |
||||||||||||||||
ElementCount |
Number of data elements in the series.
|
||||||||||||||||
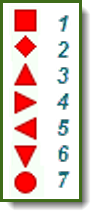
[Symbol]
|
|
||||||||||||||||
[Size] |
Optional parameter will create symbols the at size entered. Default symbol size is 12-Pixels. |
Example: |
|---|
' ~~~~~~~~~~~~~~~~~~~~~~~~~~~~~~~~~~~~~~~~~~~~~~~~~~~~~~~~~~~~~~ ' -------------------------------------------------------------- |
Returns: |
|---|
 Trade Charts Blox - Win Loss Report Image Example |
Links: |
|---|
AddLineSeries, AsSeries, Make, NewXY, resultsReportPath, SetxAxisLabels, SetAxisTitles, SetPlotArea |
See Also: |
Edit Time: 9/7/2020 2:45:05 PM |
Topic ID#: 127 |