' ~~~~~~~~~~~~~~~~~~~~~~~~~~~~~~~~~~~~~~~~~~~~~~~~~~~~~~~~~~~~~~
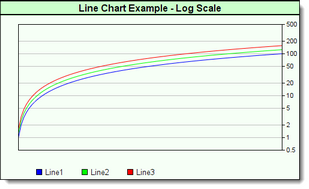
' Log Scale Line Chart Example
' ~~~~~~~~~~~~~~~~~~~~~~~~~~~~~~~~~~~~~~~~~~~~~~~~~~~~~~~~~~~~~~
' Establish Scatter Chart image size
iChartWidth = 500 ' X-Axis Width
iChartHeight = 300 ' Y-Axis Height
' Create a image
chart.NewXY( "Log Scale Line Chart Example", iChartWidth, iChartHeight )
' Size the Scatter Dot Ploting area
chart.SetPlotArea( 30, 30, 40, 50 )
' Use Log Scale
chart.AddLineLayer( 0, "Log" ) ' <-- Converts Linear Scale to Log Scale
' Generate Blue Color Value
ColorValue1 = ColorRGB( 255, 0, 0 )
' Generate Green Color Value
ColorValue2 = ColorRGB( 0, 255, 0 )
' Generate Red C0lor Value
ColorValue3 = ColorRGB( 0, 0, 255 )
' Add Line data series 1
chart.AddLineSeries( AsSeries( Line1 ), 100, "Line1", ColorValue1 )
' Add Line data series 2
chart.AddLineSeries( AsSeries( Line2 ), 100, "Line2", ColorValue2 )
' Add Line data series 3
chart.AddLineSeries( AsSeries( Line3 ), 100, "Line3", ColorValue3 )
' Create & Save this new chart as a file.
' Always add a backSlash Character after "resultsReportPath"
chart.Make( test.resultsReportPath + "\" + "LogChartExample.png" )
|

