AddContourLayer
Applies a 3-Dimensional contour layer color map onto a newly created NewXY chart.
Note:
This function must be executed after the NewXY statement has sized the chart.
AddContourLayer requires data for the X,Y and Z data series, which are the first three parameters. Fourth parameter requires the count of the number elements in the Z-Axis series.
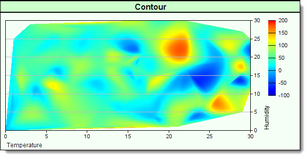
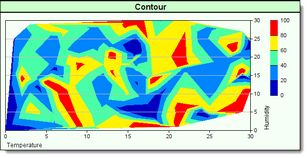
An optional "Smooth" parameter can be applied so that the color transitions between each of the different levels displayed are shown as blended color gradient transition between area colors.
Contour maps display the X-Axis scale below the plotting areas lower chart boundary. Y-Axis scale is displayed just outside the plot areas right side boundary. Z-Axis scale steps are displayed in the area between the outside boundary Y-Axis scale. White space on the right side of a contour chart needs to provide enough pixel space to enable the Z-Scale color legend to display so that it doesn't interfere with the Y-Scale display.
Creating the extra space around plotted areas is created by the use of the SetPlotArea function.
Note:
Use with all BPV Numeric or String series that are passed to any Chart parameter.
AsSeries(...) function conditions the series so the chart function will be able to use the information contained within each of the series elements.
Syntax: |
|---|
chart.AddContourLayer( AsSeries(XAxisSeries), _ AsSeries(YAxisSeries), _ AsSeries(ZAxisSeries), _ SeriesCount, _ [Smooth] ) |
Parameter: |
Description: |
|
|---|---|---|
XAxisSeries |
X-Axis Series data. |
|
YAxisSeries |
Y-Axis Series data. |
|
ZAxisSeries |
Z-Axis Series data. |
|
SeriesCount |
The integer value specifies the number of data element values in of all three of the data series specified.
|
|
Smooth |
Optional: When left out, chart will draw contours with clear line definitions between the contour colors levels creating levels that change with clear level lines.
When the optional "Smooth" is added the color changes showing the different contour levels will have a blended color change transition indicating the landscape level change have a smooth contoured slope. |
Example: |
|---|
' ~~~~~~~~~~~~~~~~~~~~~~~~~~~~~~~~~~~~~~~~~~~~~~~~~~~~~~~~~~~~~~ |
Links: |
|---|
AsSeries, Make, NewXY, resultsReportPath, SetAxisTitles, SetPlotArea |
See Also: |
Chart, Chart Director Help Information
|
Edit Time: 9/7/2020 2:43:01 PM |
Topic ID#: 119 |


