AddBarSeries

Contents
AddBarSeries adds a different series of data on a chart display.
Note:
To add an addition bar group to a chart, call AddBarSeries again with a different data series.
Syntax: |
|---|
chart.AddBarSeries( AsSeries( BarSeries ), Elements ) |
Parameter: |
Description: |
|
|---|---|---|
BarSeries |
The BPV numeric series intended to represent a group of bars.
Note: Use with all BPV Numeric or String series that are passed to any Chart parameter.
AsSeries(...) function conditions the series so the chart function will be able to use the information contained within each of the series elements. |
|
Elements |
The count of the numeric elements in the series.
|
Example: |
|---|
' ~~~~~~~~~~~~~~~~~~~~~~~~~~~~~~~~~~~~~~~~~~~~~~~~~~~~~~~~~~~~~~ |
Returns: |
|
|---|---|
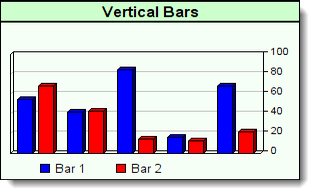
NewXY Option "Vertical" Not Enabled.
|
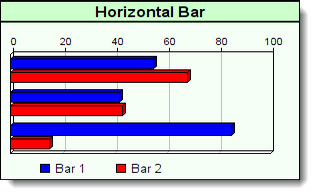
NewXY Option "Vertical" Enabled.
|
Links: |
|---|
AddBarLayer, AsSeries, Make, NewXY, ResultsReportPath, SetPlotArea |
See Also: |
Edit Time: 9/7/2020 2:42:33 PM |
Topic ID#: 116 |