Page 1 of 1
US Stock Rotation System
Posted: Fri Feb 20, 2015 8:05 am
by AFJ Garner
Anthony, I wonder if I could trouble you to run a stock test for me, I dont think it would be much work. I do not have the necessary stock data. You may have already done this anyways. These are the rules:
Portfolio = all tradeable stocks & ETFs
Buy the top 100 performing instruments with a 3-month lookback.
Rebalance monthly - sell all instruments, buy top 100
Equal $ position sizing
No liquidity, price, volatility, etc. filters
No commissions, slippage, interest, etc.
Let me know if this is easy for you to do.
CAGR% Max Total Equity DD
31.03% 51.60%
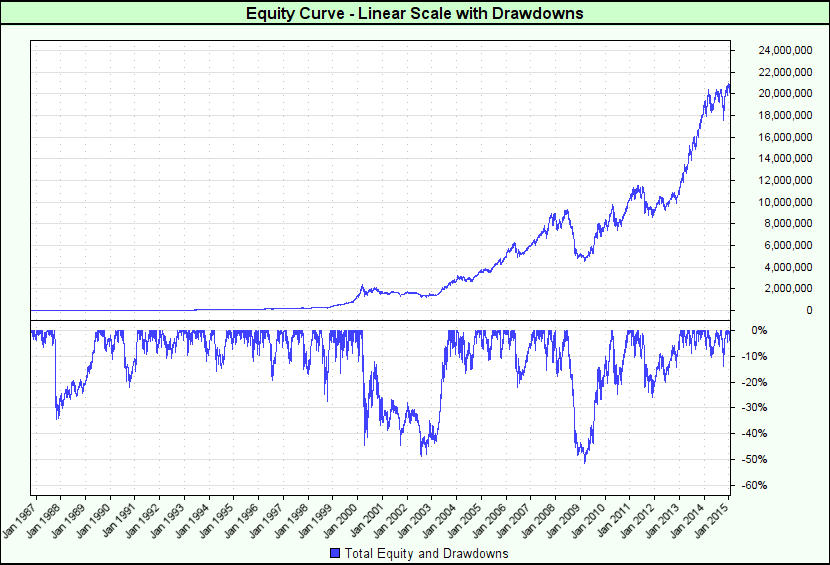
- LinearEquityDrawdownGraph_P1.png (31.96 KiB) Viewed 10326 times
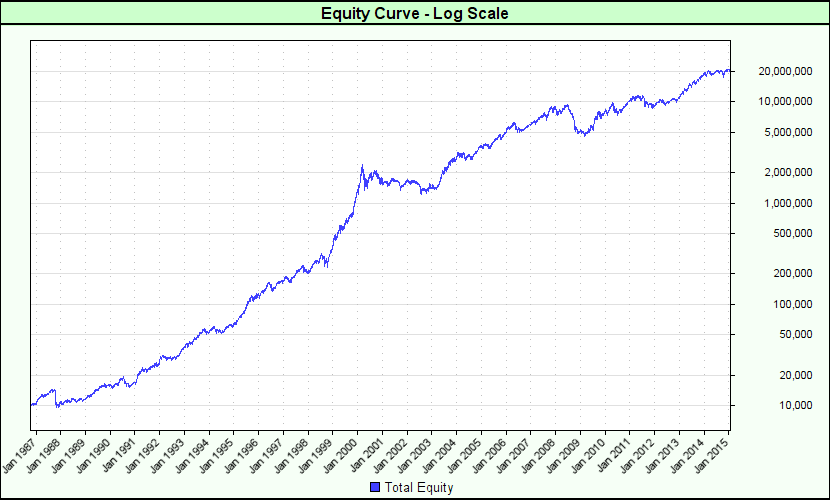
- LogarithmicEquityGraph_P1.png (23.33 KiB) Viewed 10326 times
Re: US Stock Rotation System
Posted: Fri Feb 20, 2015 8:12 am
by AFJ Garner
The above was with an average lookback over a longer period. Here is the 3 month only look back.
CAGR%:
MAD DD%:
Around 1000 listed and de-listed stock chosen solely on grounds of the highest liquidity.
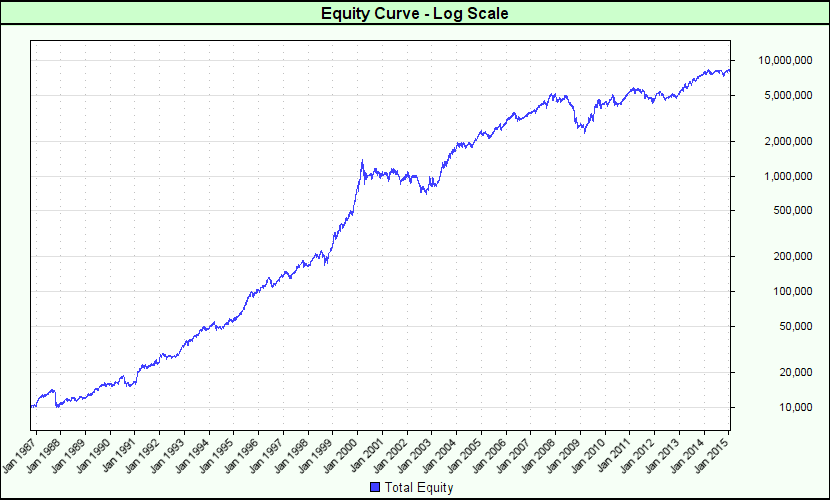
- LogarithmicEquityGraph_P1.png (22.97 KiB) Viewed 10324 times
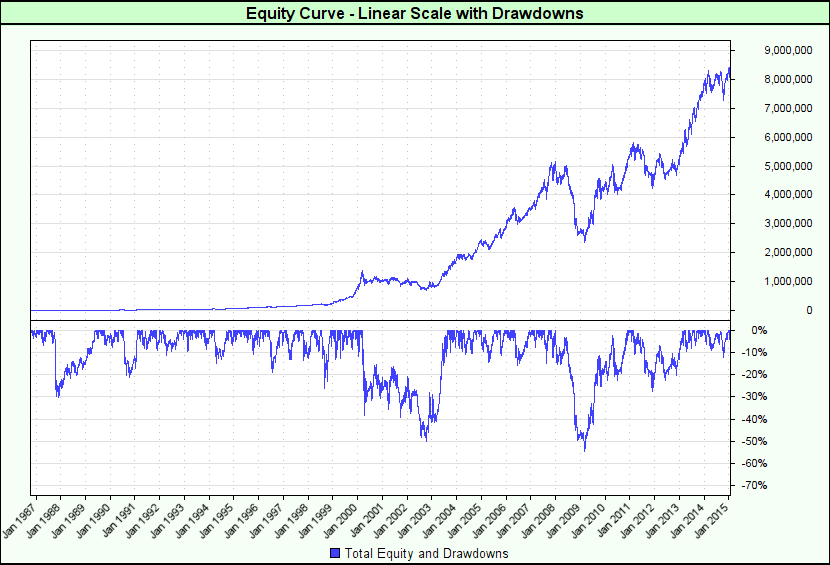
- LinearEquityDrawdownGraph_P1.png (31.25 KiB) Viewed 10324 times
Re: US Stock Rotation System
Posted: Sat Feb 21, 2015 10:07 am
by Louis Crowder
Hi Anthony,
Thanks very much for the post. I think you left out the CAGR and Max DD for the second test.
Louis Crowder
tradingautomation.com
Re: US Stock Rotation System
Posted: Sun Feb 22, 2015 12:32 pm
by sluggo
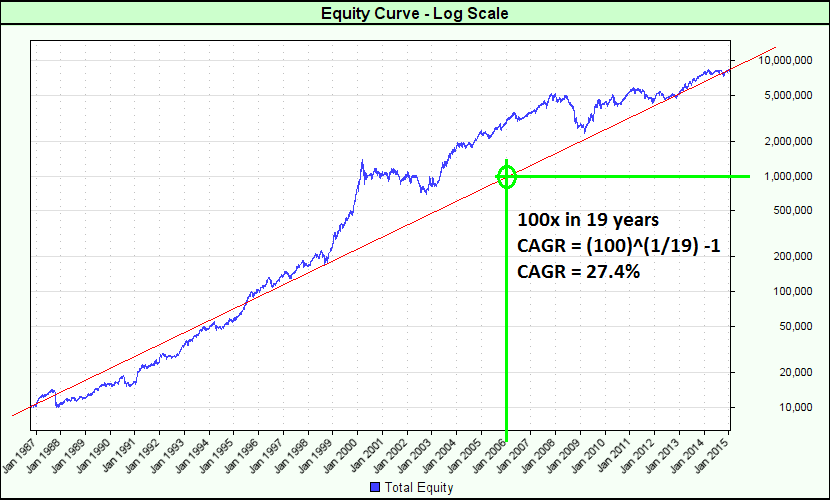
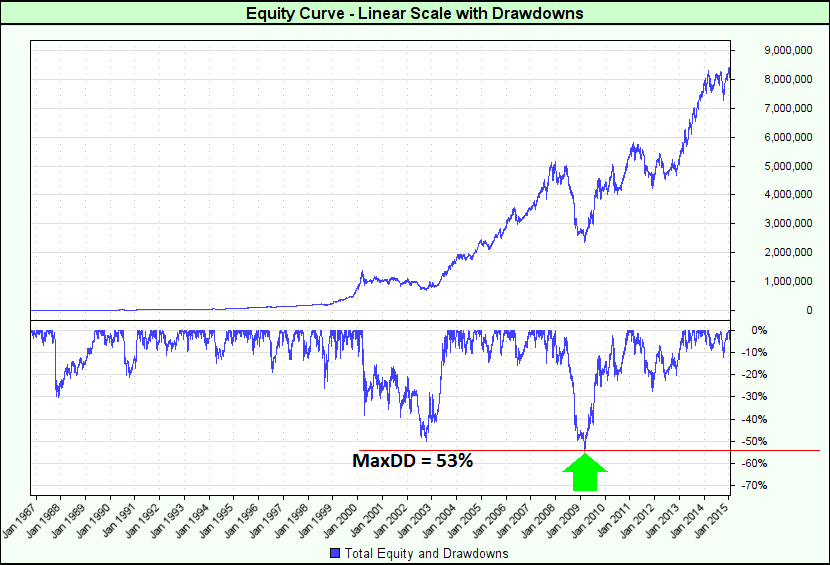
Sometimes it benefits you AND your employees when you give them little side-projects that expand their knowledge. For example, you could give one of your employees the project "Estimate the CAGR and the MaxDD of the equity curves just posted by Anthony Garner".
My employee turned in the following pair of graphs, with the answers: CAGR = approx 27.4% , MaxDD = approx 53% . Both answers appear correct to me.
- DEDUCE_CAGR.png (30.74 KiB) Viewed 10283 times
- DEDUCE_MAXDD.png (35.22 KiB) Viewed 10283 times
Re: US Stock Rotation System
Posted: Sun Jun 07, 2015 9:35 am
by LeviF
Does this include dividends? What does it look like without?
Re: US Stock Rotation System
Posted: Sun Jun 07, 2015 11:05 am
by AFJ Garner
Yes. But the portfolio was only around 1,000 stocks I seem to recall which had been preselected by liquidity. I think the better approach is to select ALL stocks you have access to and then filter by 90 day liquidity or some such as you go along. I selected all non OTC US stocks with a history of at least 1 year from the CSI database; it came to 14,000 stocks. I have reached no conclusions yet since it is painful running tests on a portfolio of that size with my 16 GB ram laptop. Once my new 64 GB arrives I'll try and remember to publish some results.
A
Re: US Stock Rotation System
Posted: Tue Jun 23, 2015 10:33 am
by AFJ Garner
So, here is what I did. I queried the CSI sdbfacts.csv file and extracted the 14,000 listed US stocks on NYSE, NASDAQ and AMEX which had a trading history of over 1 year. You can see below how many instruments this consists of on a time series basis (obviously the stocks had different start and end date since they included de-listed stocks and of course stocks coming to the market over the years). Note that the current total of around 8,000 instruments greatly exceeds the number of companies listed on US markets (around 5,500 including foreign stocks) and this is because different share classes as well as preference shares and so forth are included. No matter.
I then ran a monthly rotational stock system on the top 300 from 1987 (an institutional kind of size) and got very pleasing results : CAGR 13%+, Max DD 27%, very high Rsq.
I put a filter in which chose to trade only the top 50% in terms of liquidity. Liquidity measured once a quarter and based on turnover.
I will write the tests up in full and put them on my website.
Disappointingly, using a much smaller figure for X, the number of stocks into which to rotate, provided unacceptable results. I am looking at why in depth.
I am a little concerned at CSI's coverage and am left wondering how complete it is in the early years. As ever in back testing the data is always the biggest problem. When it comes to curve fitting however, one can rest reasonably assured that the portfolio has NOT been cherry picked.
Re: US Stock Rotation System
Posted: Mon Jul 27, 2015 3:40 pm
by HWG
AFJ Garner wrote:Anthony, I wonder if I could trouble you to run a stock test for me, I dont think it would be much work. I do not have the necessary stock data. You may have already done this anyways. These are the rules:
Portfolio = all tradeable stocks & ETFs
Buy the top 100 performing instruments with a 3-month lookback.
Rebalance monthly - sell all instruments, buy top 100
Equal $ position sizing
No liquidity, price, volatility, etc. filters
No commissions, slippage, interest, etc.
Let me know if this is easy for you to do.
CAGR% Max Total Equity DD
31.03% 51.60%
LinearEquityDrawdownGraph_P1.png
LogarithmicEquityGraph_P1.png
Anthony, quick question for you. I'm looking to do a monthly rebalance system as well and struggling with the code for something like that.
I considered using IF instrument.date [lastDayOfMonth] = TRUE THEN do something on tomorrow's opening.
I didn't see anything for first trading day of the month.
There's a rebalance block built in TB but looks a bit more complicated than I was expecting.
This would be for futures use.
Thanks.